Building ML Systems to Analyze Meta Ad Library Data
What makes some ads run for 60+ days while others die in a week? An ML system that extracts 72 features and predicts ad success with 92.7% accuracy.
Picture scrolling through Meta’s Ad Library, trying to figure out what competitors are doing. The ads are visible, sure, but there’s no way to tell which ones are actually working. Is that creative running because it’s performing well, or because no one has gotten around to turning it off?
This is a common challenge. Teams often spend weeks manually analyzing competitor ads. Screenshot this, note that, try to spot patterns. It can eat 15+ hours every week, and still leave basic questions unanswered like “what creative strategies are actually winning in this market?”
Here’s the problem: Meta’s Ad Library is designed for transparency, not analysis. It’s a firehose of ads with no way to:
- Track which ads have been running the longest (a proxy for success)
- Analyze creative patterns at scale
- Identify what messaging strategies dominate a category
- Predict whether a new ad concept will likely succeed
Meanwhile, tools like Apify charge thousands per month just for raw scraping, no ML analysis included.
This is where ML-powered systems come in. The system covered here scrapes the Ad Library, extracts 72 features from each ad, and predicts success with 92.7% accuracy.
This article breaks down exactly how such systems work.
How Such Systems Are Built: From Zero to 92.7% Accuracy
Before diving into the technical architecture, here’s how a system like this comes together: the problems encountered, the tools that work, and the decisions that lead to 92.7% accuracy.
Step 1: Building the Scraper (The Hardest Part)
The first challenge is getting data at scale. Meta’s Ad Library technically has an API, but with rate limits so low it’s useless for competitive analysis. No export functionality. And third-party scraping services like Apify and Bright Data? Thousands per month just for raw data, no ML included.
Common Approaches That Don’t Work: - Meta’s official API → rate limited to ~200 requests/hour (would take weeks for one brand) - Standard Selenium → detected and blocked in minutes - Simple request libraries → can’t render JavaScript-heavy content
What Actually Works:
A custom scraper using undetected-chromedriver with aggressive anti-detection:
The Scraping Strategy: Instead of loading all ads at once (impossible since Facebook uses DOM virtualization), the approach is “incremental scroll-and-scrape”:
- Load Ad Library URL with filters (brand, active, media type)
- Wait for initial 10-12 ads to render
- Scrape visible ads into memory
- Scroll down to trigger next batch
- Repeat until max ads (800/brand) or no new ads after 5 scrolls
- Batch-save every 10 ads to database (resilience)
The Numbers: - 800+ ads per brand (full catalog, not just first page) - 40+ fields extracted per ad - 3 parallel scrapers for multiple brands simultaneously - Batch saves every 10 ads to survive crashes
Step 2: The Data Collected
Each ad gets 40+ raw fields before any ML processing:
The Critical Insight: Longevity as Ground Truth
Without actual performance data (which Meta doesn’t share), we need a proxy for “success.” The solution is longevity tiers.
Advertisers keep running ads that work. An ad surviving 60+ days is almost certainly performing.
Step 3: Feature Engineering (The Real Work)
Raw ad data is useless to ML models. The system extracts 72 structured features from each ad:
Text Features (32 features) - Sentiment score (rule-based, -1 to +1) - Flesch readability (0-100) - Urgency keywords detected (15 patterns) - Social proof signals (17 patterns)
VLM Features (15 features) - Together AI’s Llama 4 Scout analyzes each image - Extracts: visible prices, discount badges, clinical claims, quality score (1-10) - Processing time: 3-5 seconds per ad (this becomes a bottleneck)
CLIP Embeddings (512 dimensions) - Visual “fingerprint” capturing semantic meaning - Similar images → similar embeddings - Enables visual clustering and similarity search
Landing Page Alignment (10 features) - Price match validation - Claim verification against LP content - Review/rating extraction
Step 4: The Ensemble Model
Neither model alone hits 92.7%. The breakthrough is combining them:
The formula:
Final Score = (0.6 × LightGBM) + (0.4 × MLP)Why 60/40? Tested on holdout data, this ratio outperforms 50/50 and 70/30.
Tip: Start with text-only prediction (100ms). Add visual analysis for important decisions (adds 3-5s).
What You’ll Learn
By the end of this guide, you’ll understand:
- How machine learning can analyze ad creatives automatically
- The 72 features that predict whether an ad will succeed
- How gradient boosting and neural networks combine for better predictions
- How unsupervised clustering reveals competitor strategies
- What analysis reveals about what actually makes ads work
No PhD required. The technical concepts are explained in plain English.
How the System Works: A 10,000-Foot View
The system has three layers, each building on the previous one:
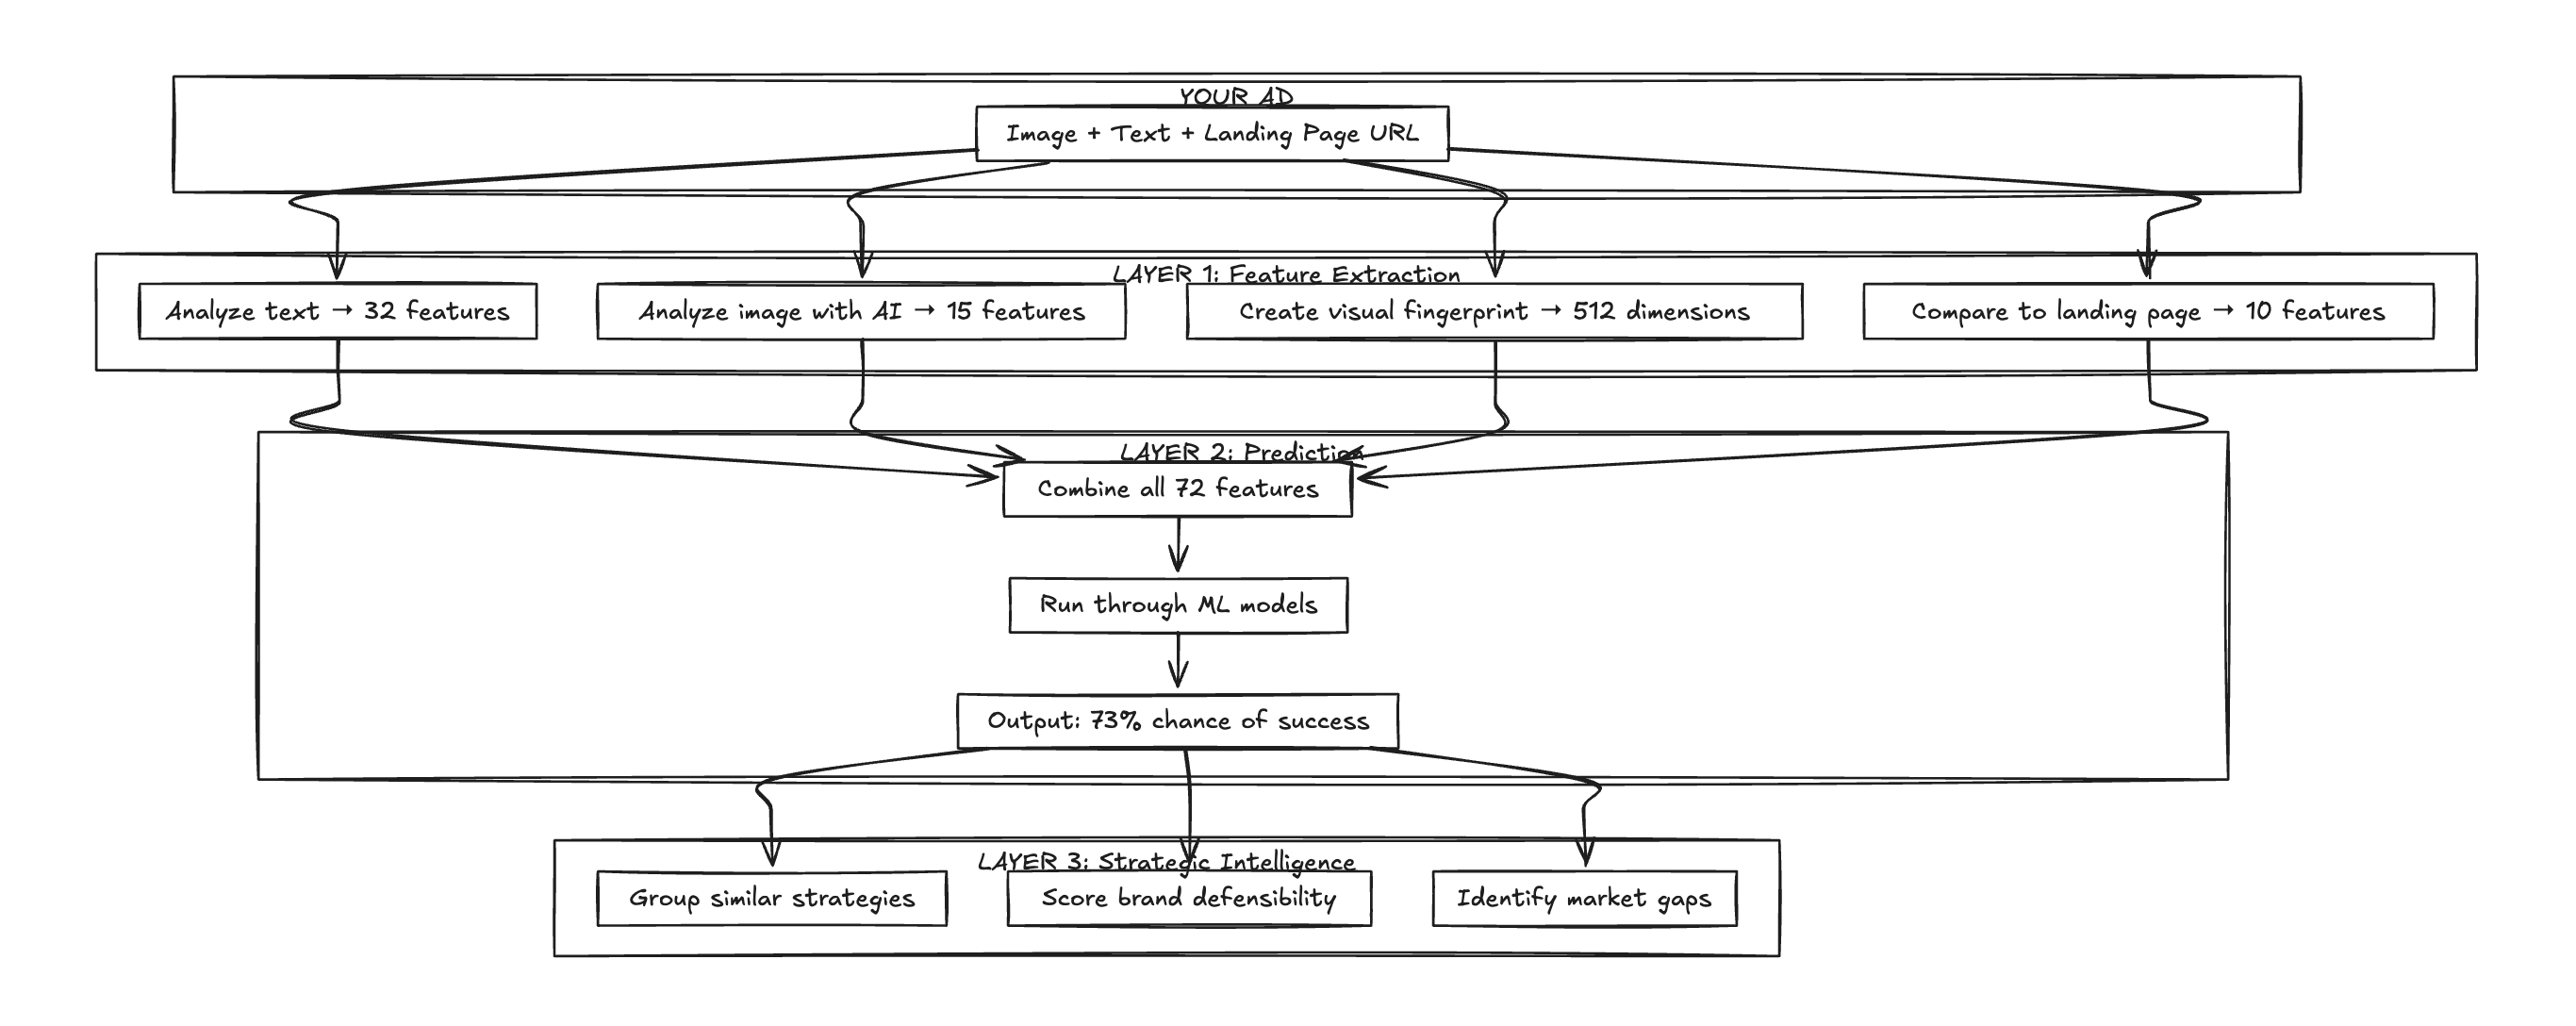
Layer 1 extracts structured data from unstructured ads. An ad is just an image and some text. The system converts that into 72 measurable features.
Layer 2 feeds those features into ML models that predict whether the ad will be a long-running success or a quick failure.
Layer 3 uses the predictions to generate strategic insights: what clusters of strategies exist, how defensible the positioning is, and where the gaps in the market are.
Here’s how each layer works.
Layer 1: Extracting 72 Features from Every Ad
The first challenge: how do you turn an ad into something a machine learning model can understand?
Feature extraction converts unstructured content (images, text) into structured numbers.
The Four Feature Sources
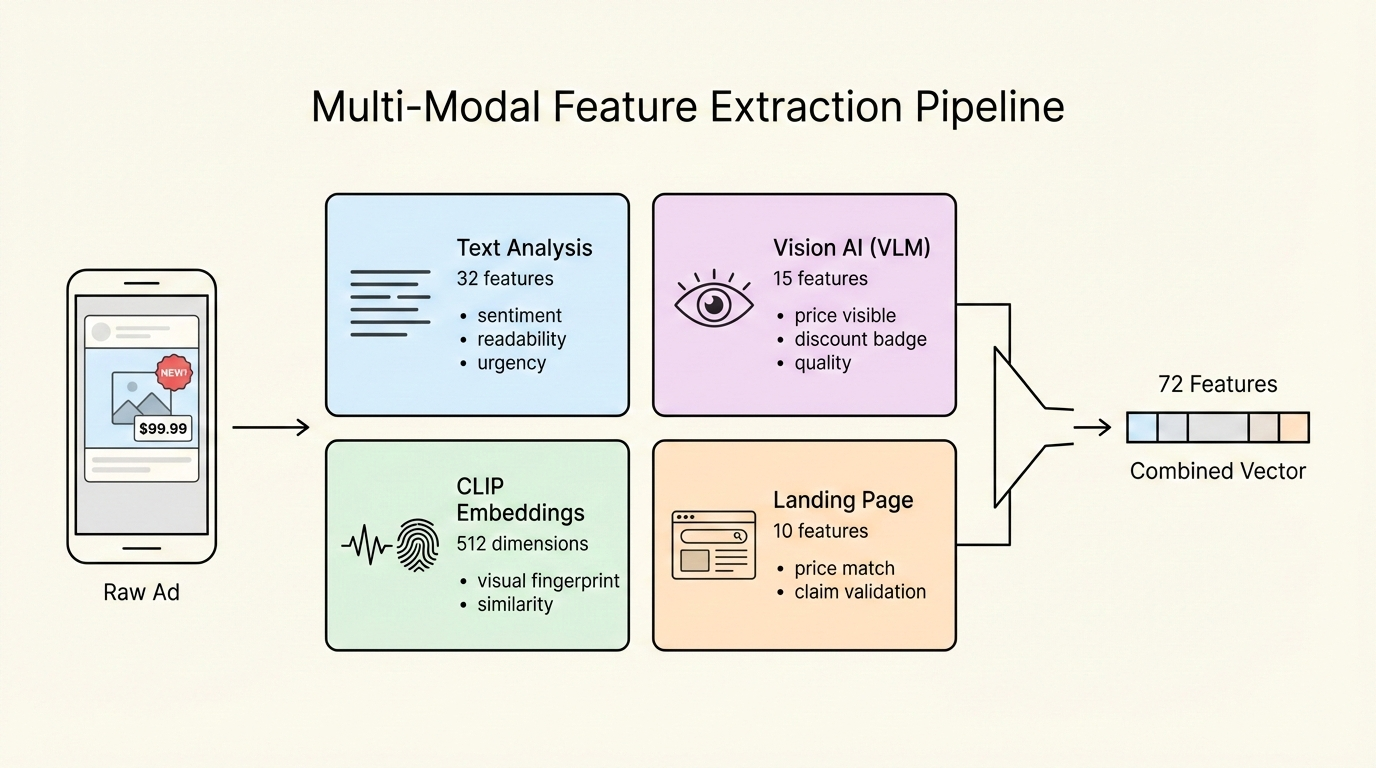
Text Features: What the Words Tell Us
The system analyzes ad copy to extract signals like:
- Sentiment score (-1 to +1): Is the language positive or negative?
- Readability (Flesch score): How easy is the copy to understand?
- Urgency signals: Does it use words like “limited time,” “act now,” or “while supplies last”?
- Social proof: Are there mentions of reviews, ratings, or “bestseller”?
- CTA type: Is it “Shop Now,” “Learn More,” or something else?
These aren’t binary flags - they’re precise measurements. For example, readability uses the Flesch Reading Ease formula, which scores text from 0 (very difficult) to 100 (very easy).
Tip: Ads with readability scores between 60-70 (8th-9th grade level) tend to perform best. Too simple feels cheap; too complex loses attention.
Vision AI: What the Image Tells Us
Text only tells half the story. The system uses a Vision Language Model (Llama 4 Scout) to “look” at each ad image and extract:
- Is there a price visible?
- Is there a discount badge?
- Are there clinical/scientific claims?
- Is there a person in the image?
- Is it a before/after transformation?
- Quality score (1-10)
- Mood (luxurious, clinical, playful, natural, bold)
This is like having a human reviewer analyze every ad, except it takes seconds instead of minutes.
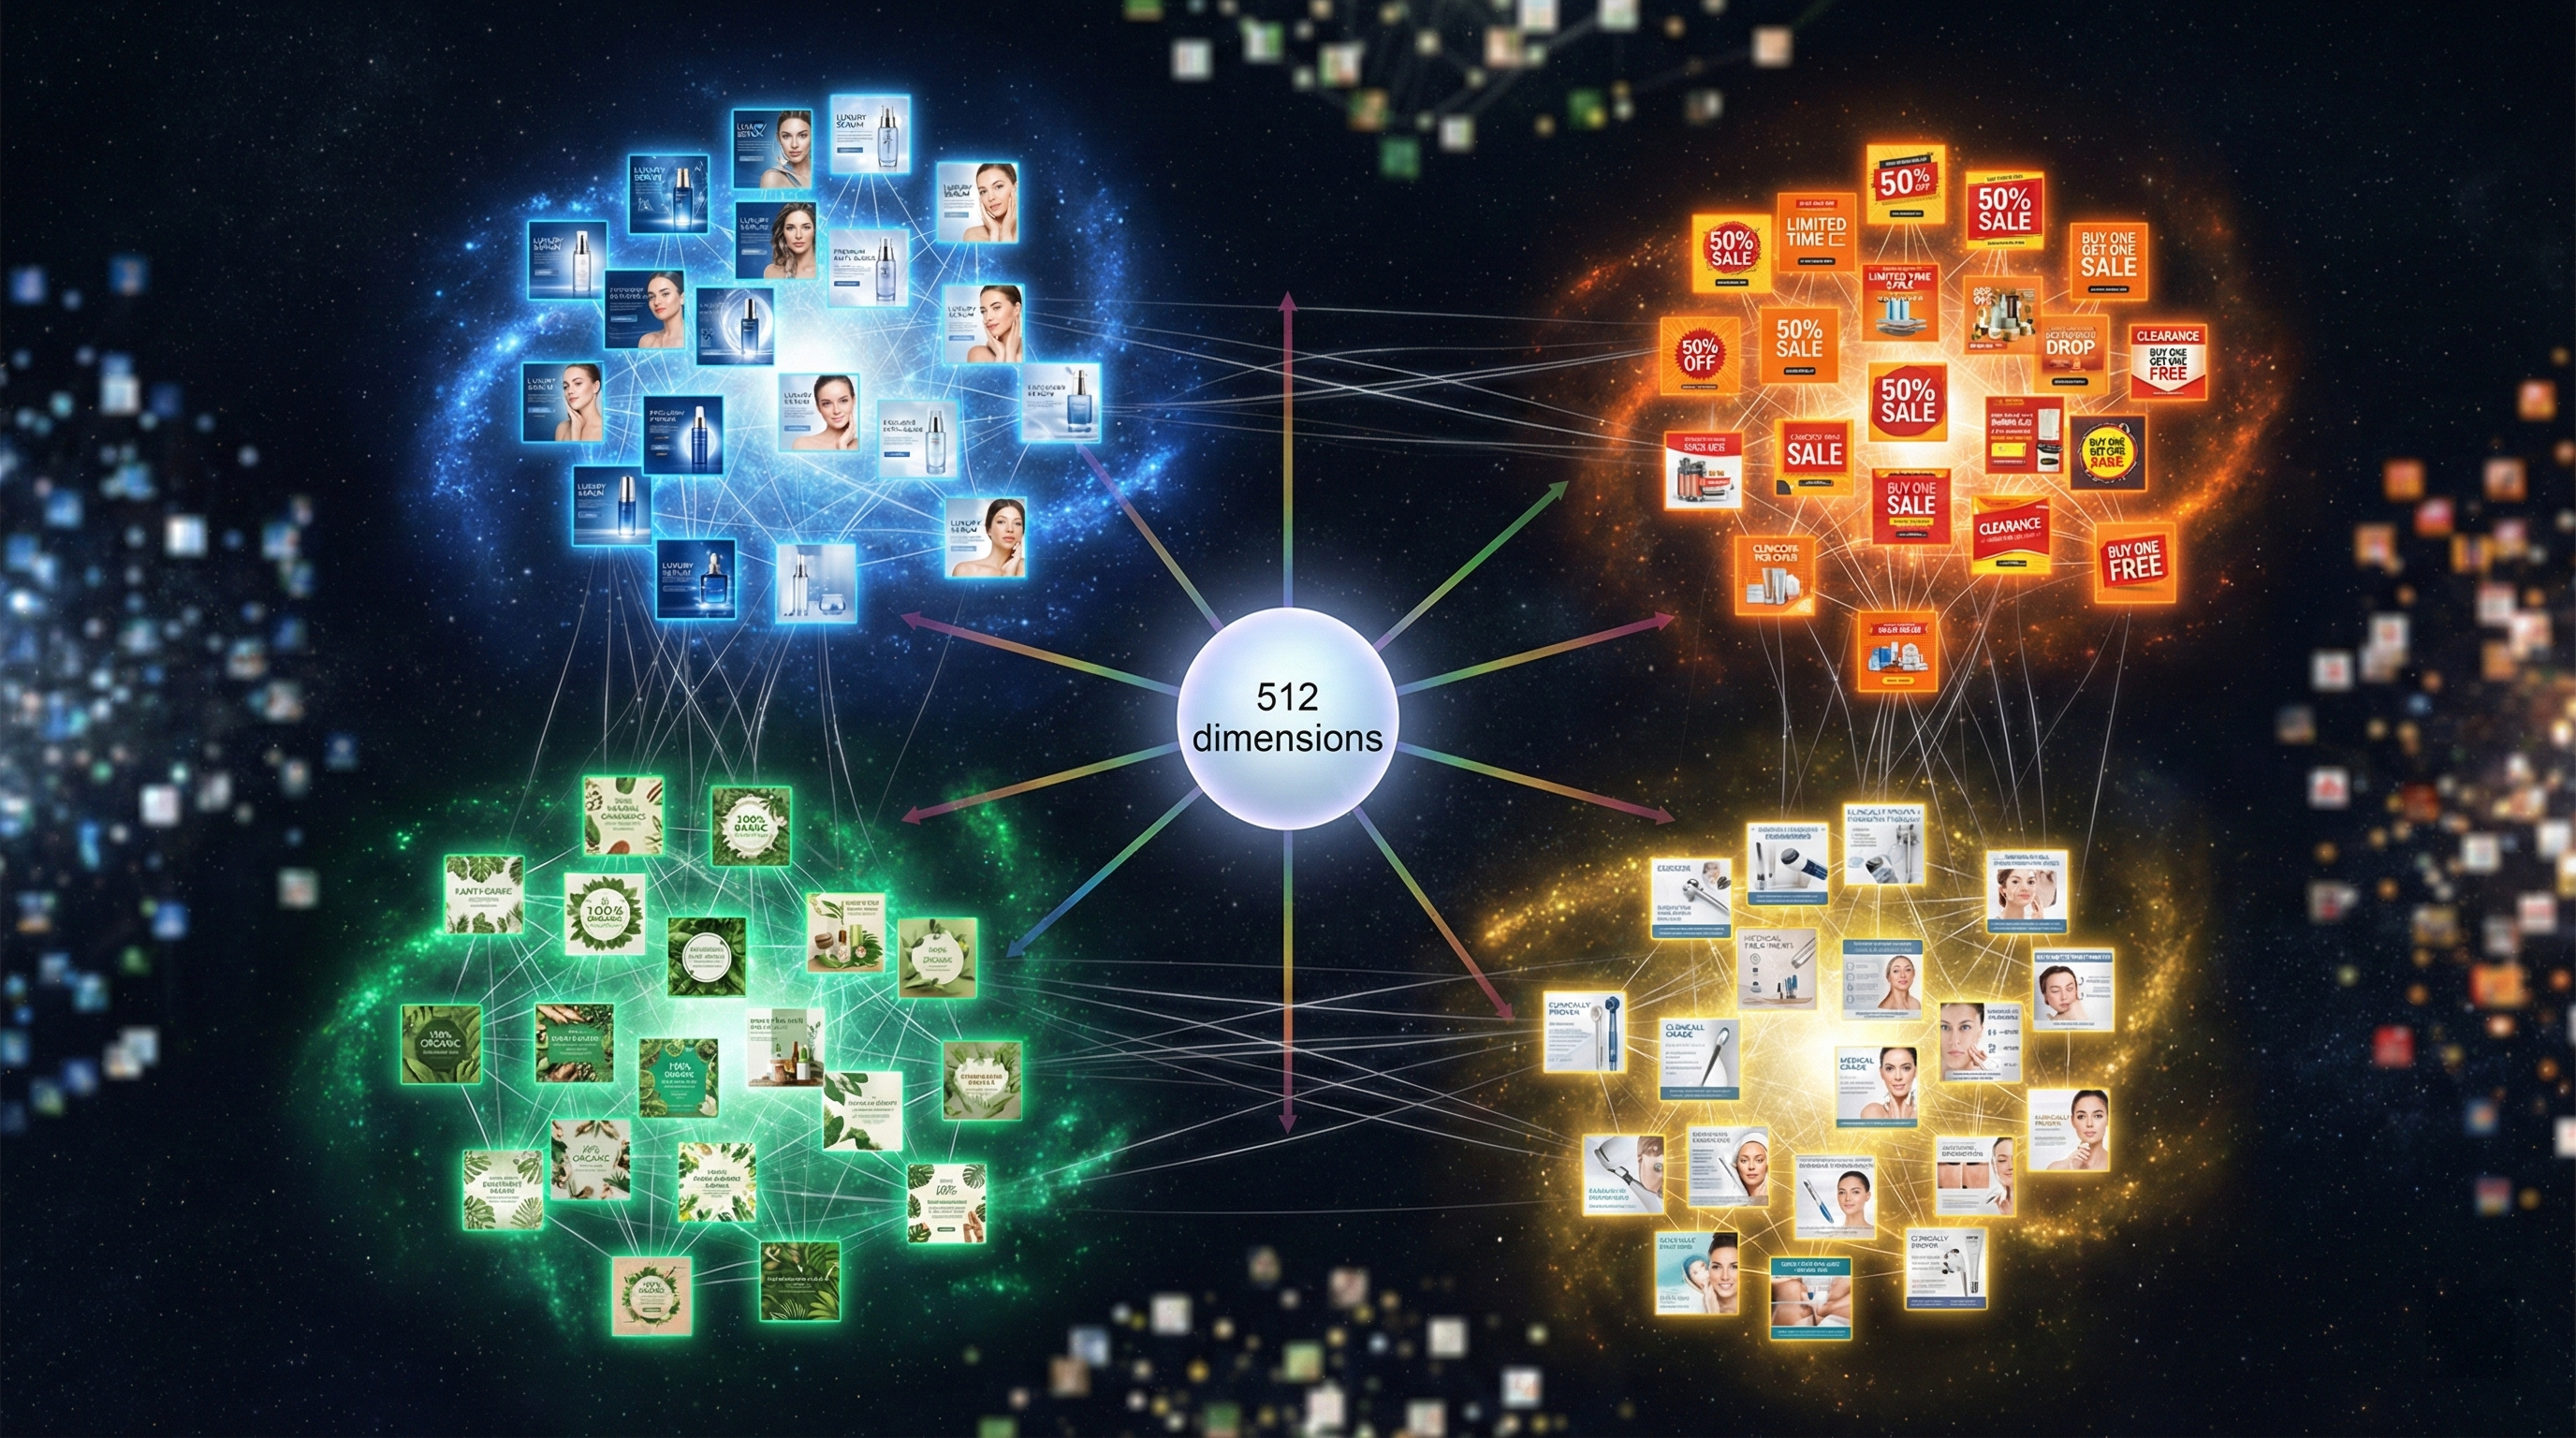
Visual Fingerprint: The 512-Dimensional “Meaning”
The system uses OpenAI’s CLIP model to create a “fingerprint” of each image - a 512-dimensional vector that captures the semantic meaning of the visual.
Similar images have similar fingerprints. A luxury skincare ad and another luxury skincare ad will be close together in this 512-dimensional space, even if they use completely different products, colors, and layouts.
This fingerprint enables: - Finding visually similar ads - Measuring how differentiated a brand’s visuals are from competitors - Clustering ads by visual strategy (more on this later)
Landing Page Alignment: Does the Ad Deliver?
The final feature source compares the ad to its landing page:
- Price match: Does the price in the ad match the landing page?
- Claim validation: Are the claims in the ad backed up on the LP?
- Ingredient overlap: Do mentioned ingredients appear on the product page?
- LP quality signals: Rating, review count, bestseller badge
Ads that promise something the landing page doesn’t deliver tend to have poor conversion rates, even if they get clicks.
Layer 2: Predicting Success with 92.7% Accuracy
Now there are 72 features for each ad. The next step: use machine learning to predict which ads will succeed.
The Two Models Working Together
The system uses two different ML models and combines their predictions:
Model 1: LightGBM (Text-Based)
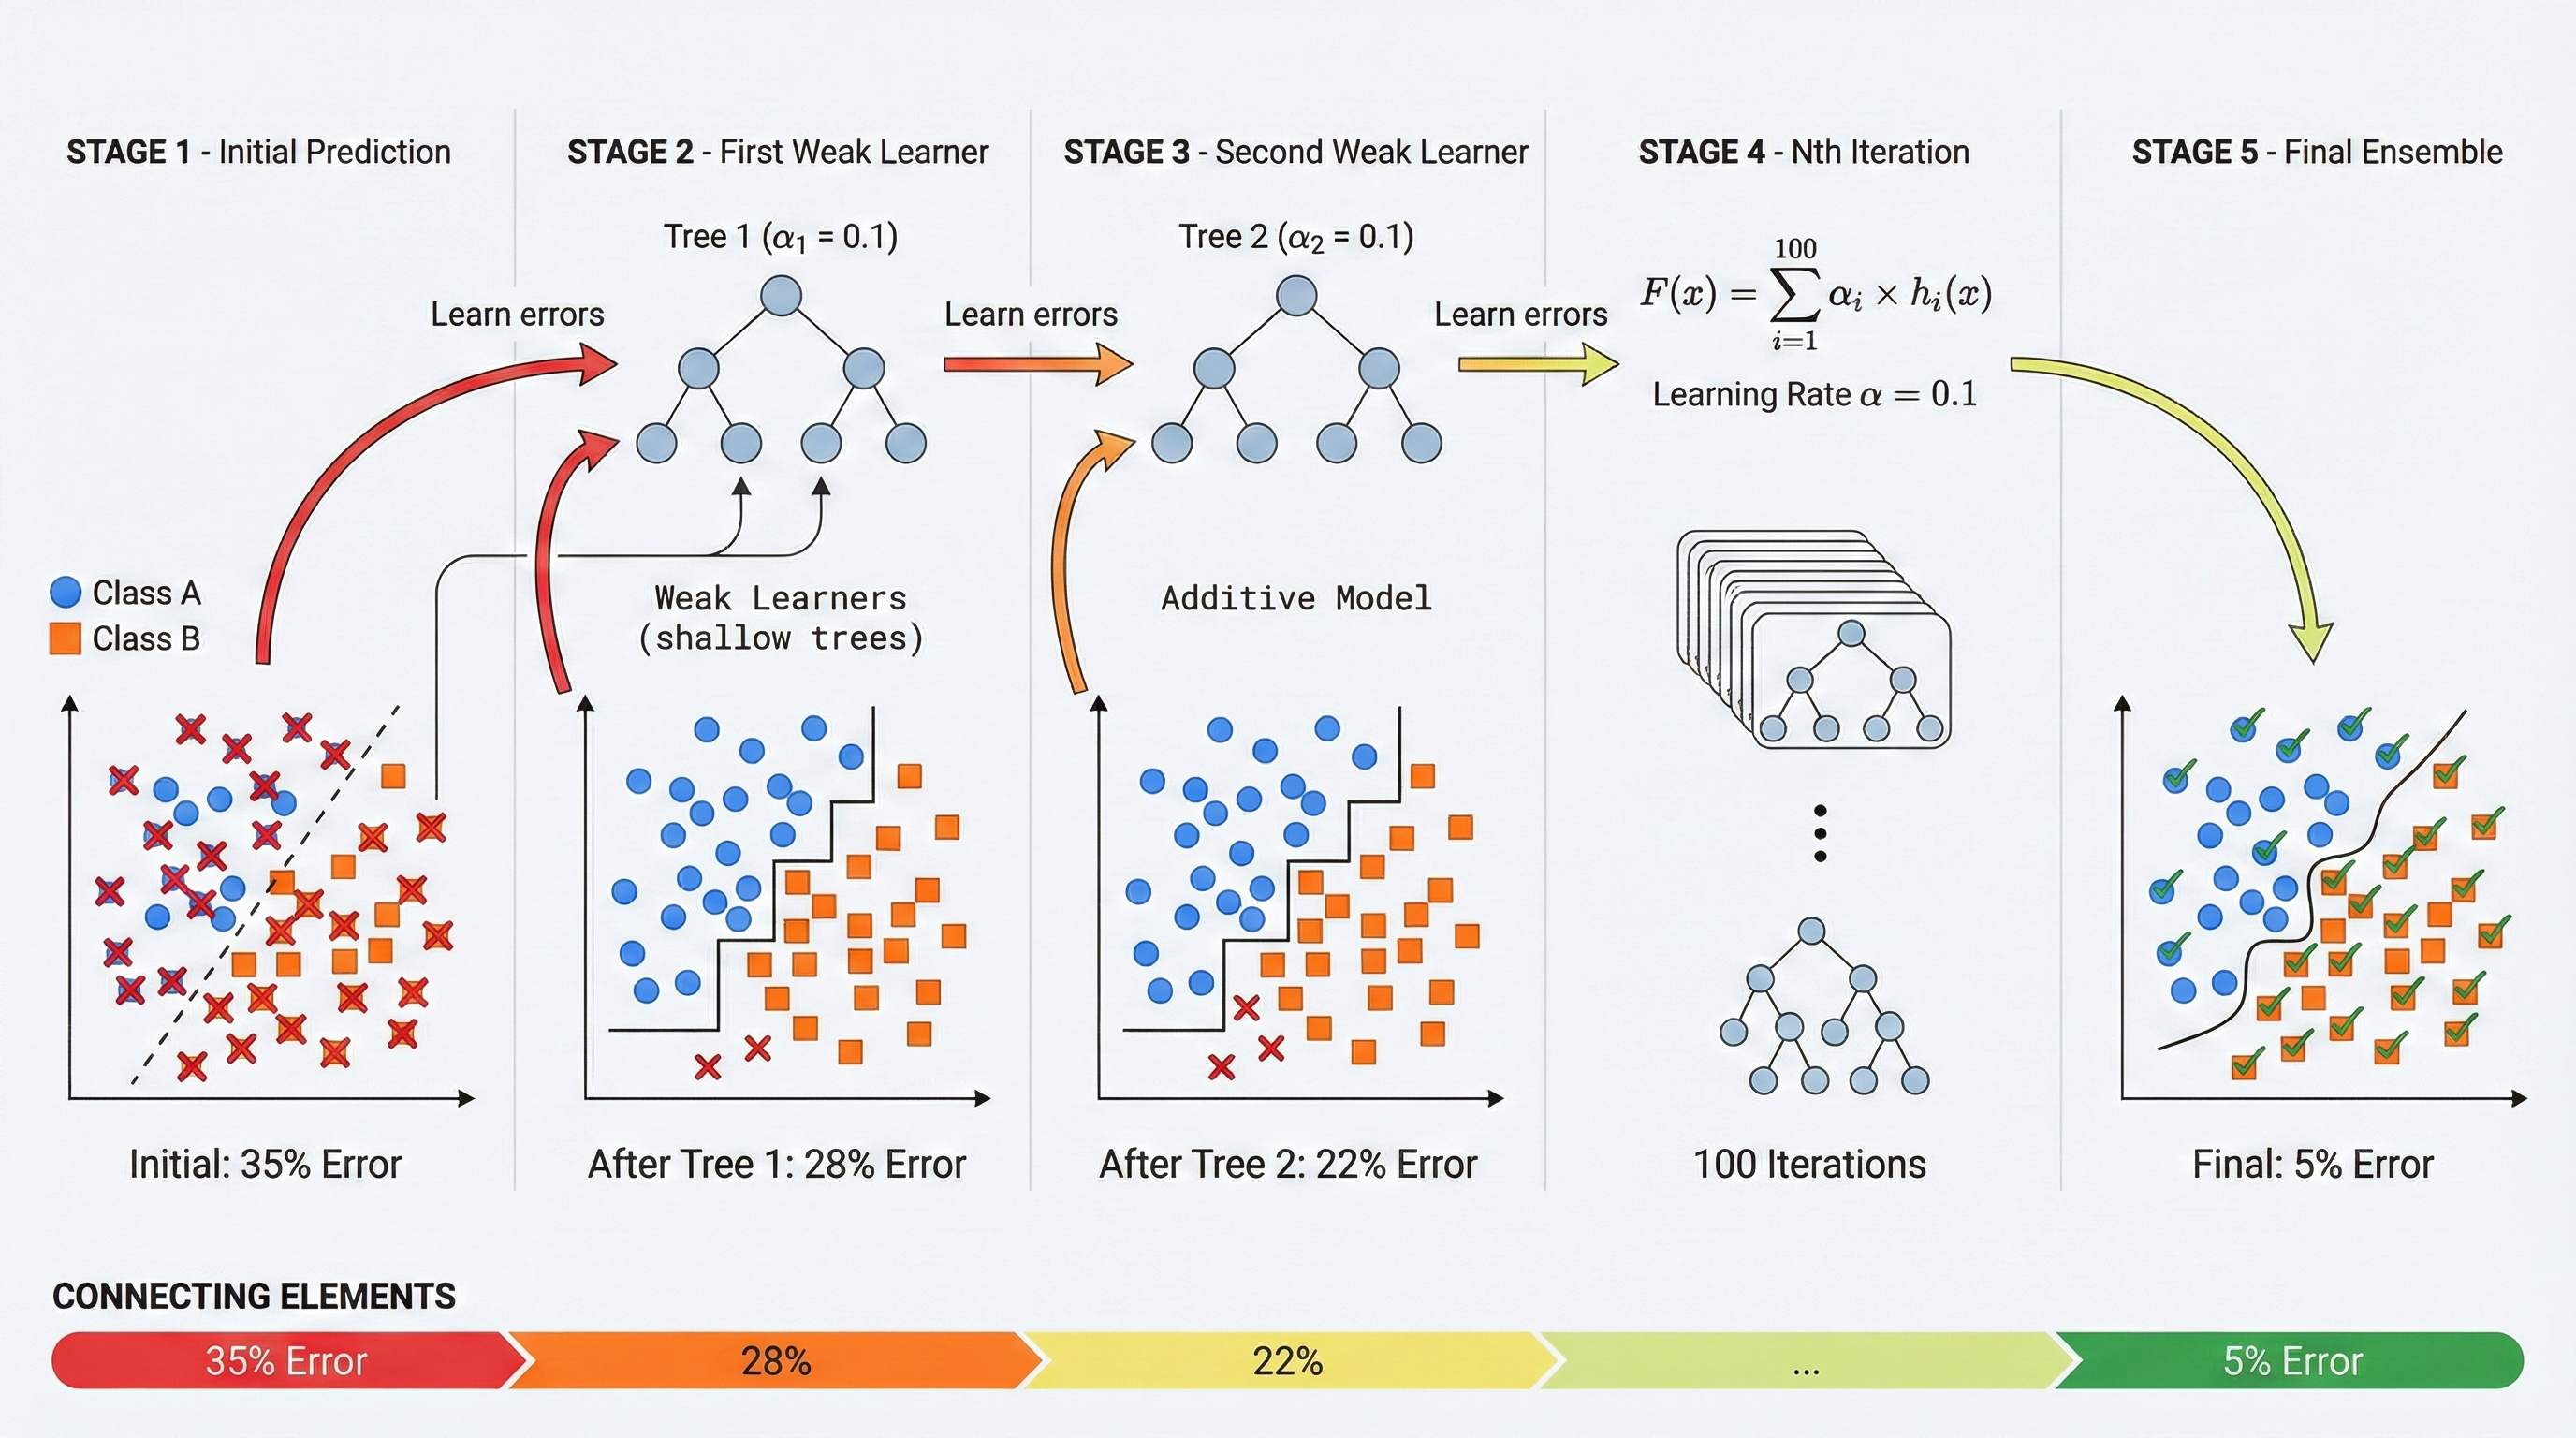
Think of LightGBM like 100 experts voting on whether an ad will succeed. Each expert (decision tree) looks at the features and makes a prediction. Some experts specialize in urgency signals, others in readability, others in landing page alignment.
The final prediction combines all 100 votes, weighted by how reliable each expert has been historically.
The algorithm uses gradient boosting (trees built sequentially, each correcting previous errors), with 100 trees and 5-fold cross-validation to prevent overfitting.
Model 2: Neural Network (Visual)
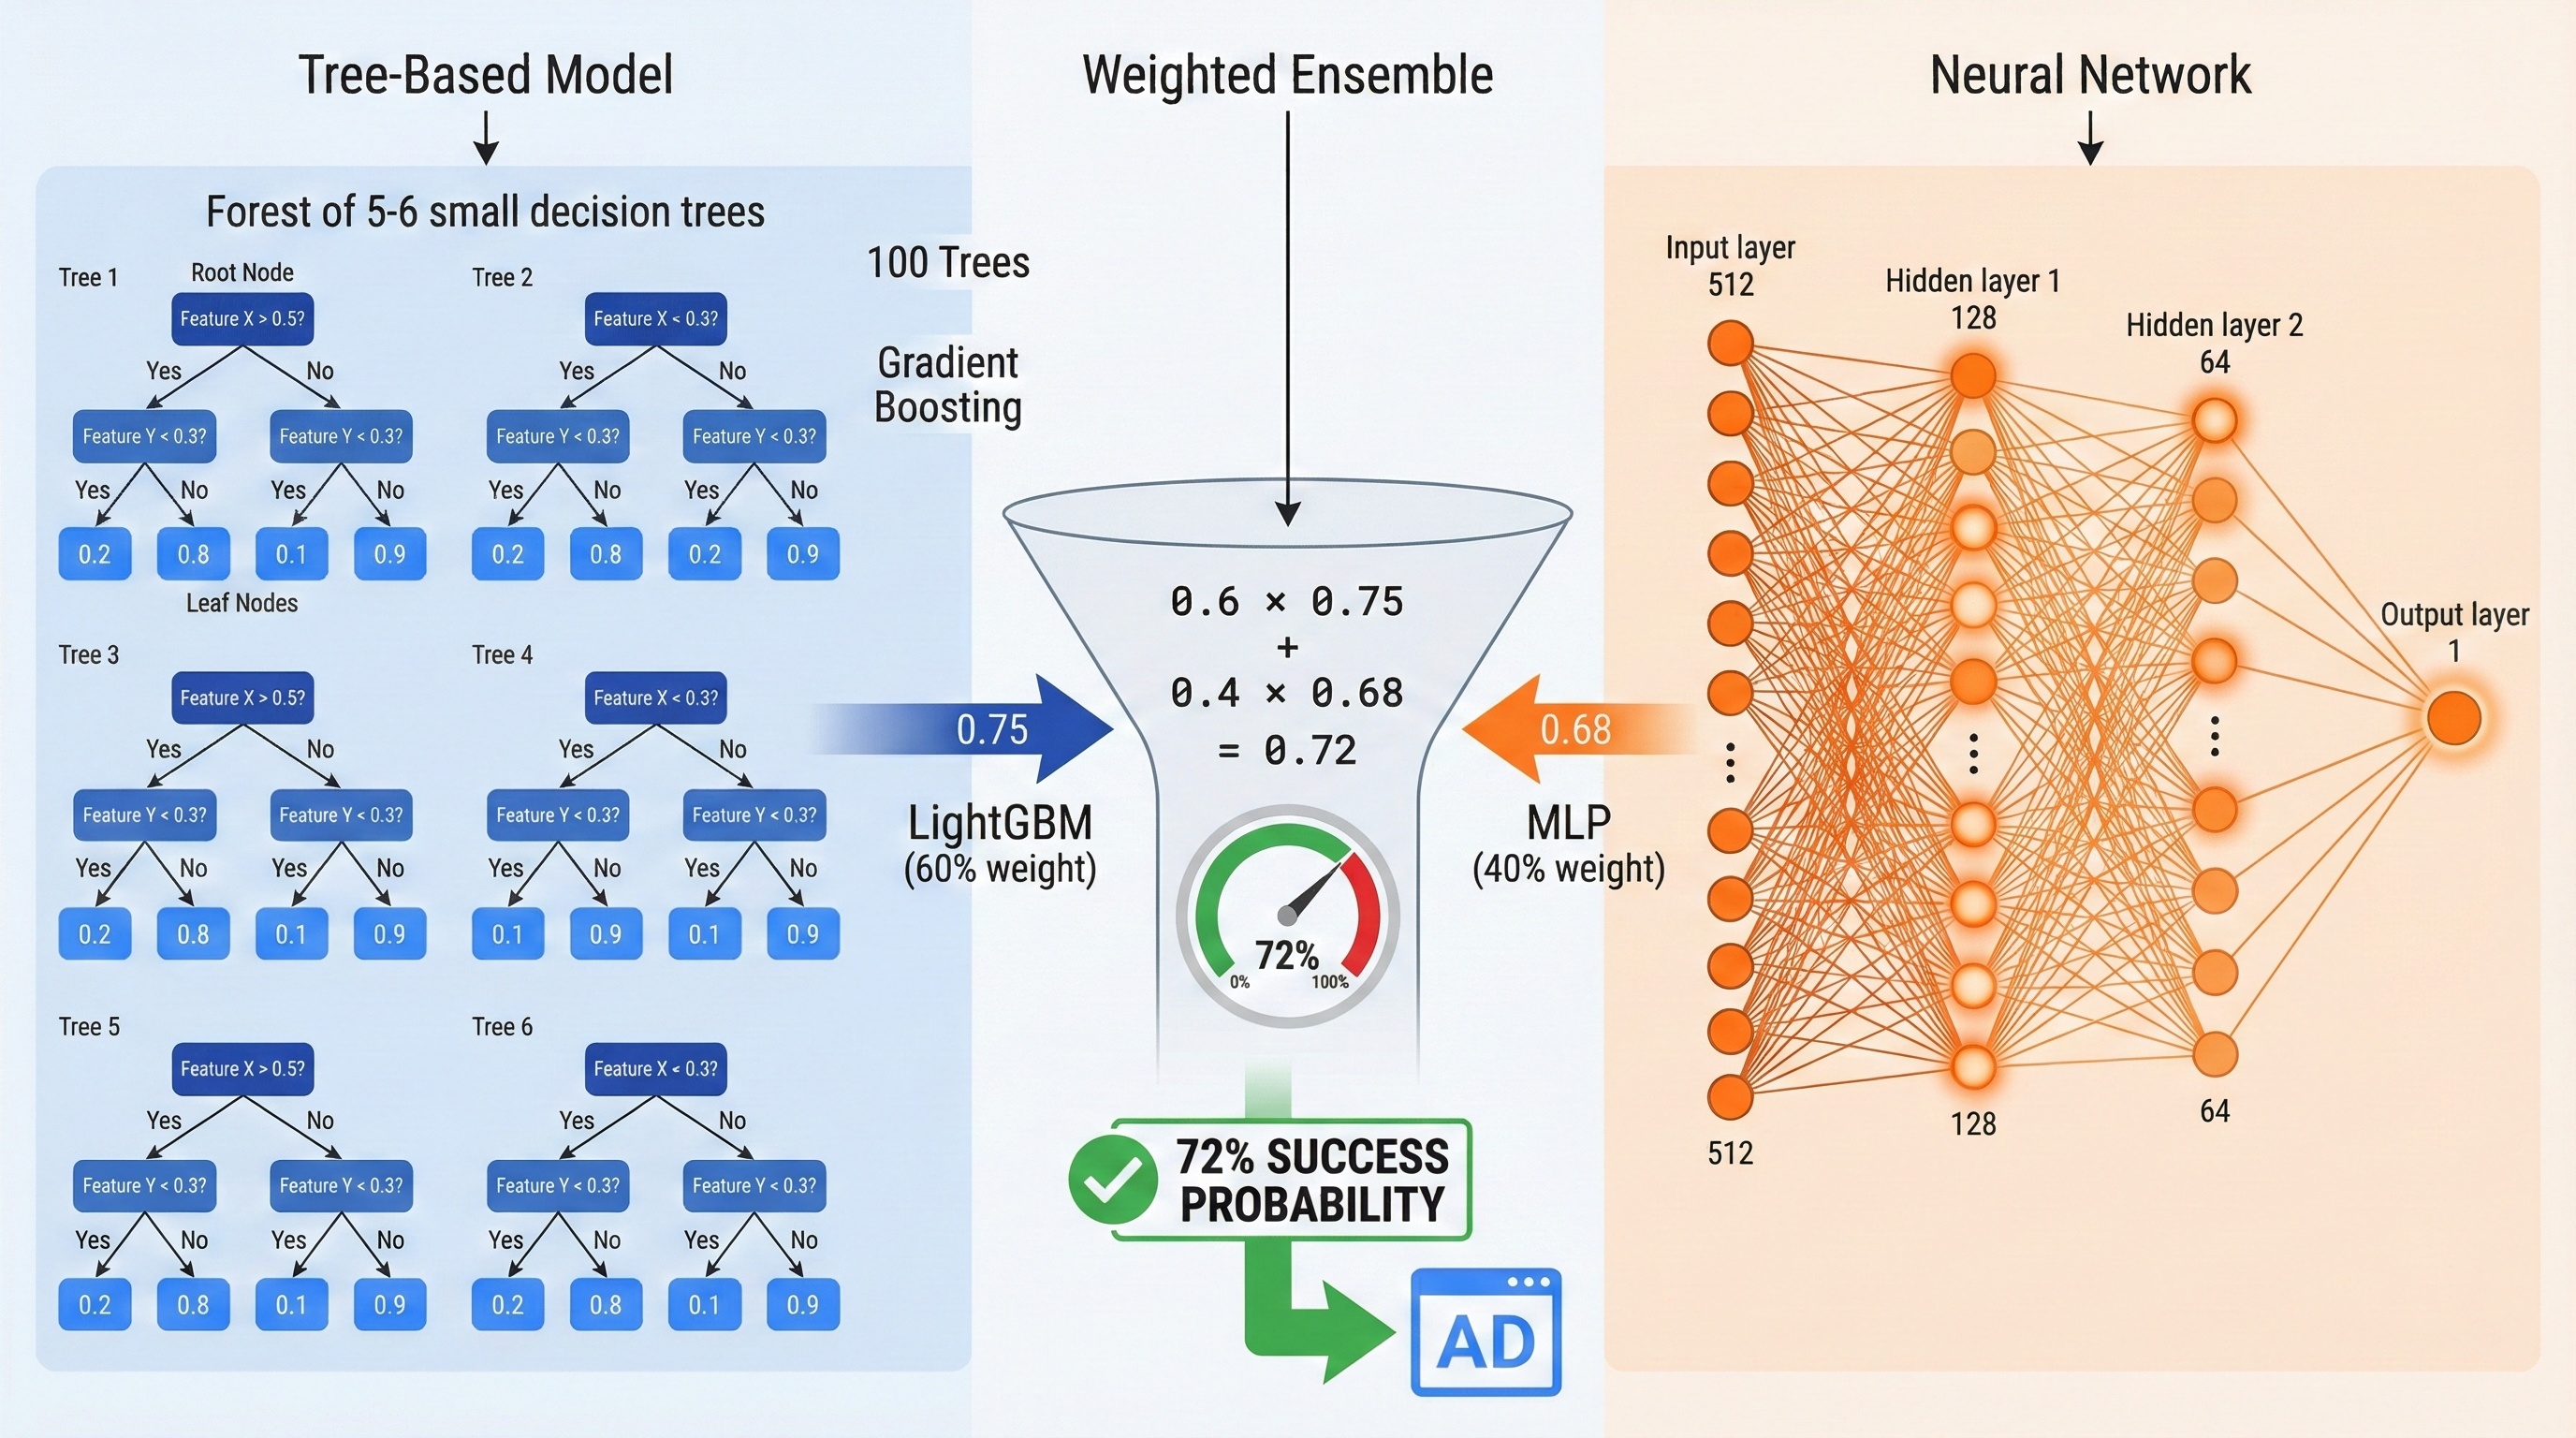
The neural network takes the 512-dimensional visual fingerprint and processes it through layers:
512 inputs → 128 neurons → 64 neurons → 1 output (probability)This model captures patterns that are purely visual, things that can’t be expressed in text features.
The Ensemble: Combining Both
The final prediction combines both models:
Final Score = (60% × LightGBM score) + (40% × Neural Network score)Why 60/40? In testing, the text-based model was more reliable, but the visual model caught patterns the text model missed. This blend performs better than either model alone.
Performance Metrics
Tip: The model also outputs a confidence level. High confidence (>80%) predictions are more reliable. For medium-confidence predictions (50-70%), consider A/B testing before committing budget.
Layer 3: Finding Competitor Strategies Automatically
Individual ad predictions are useful, but the real insight comes from analyzing ads in aggregate. That’s where clustering comes in.
How Clustering Works
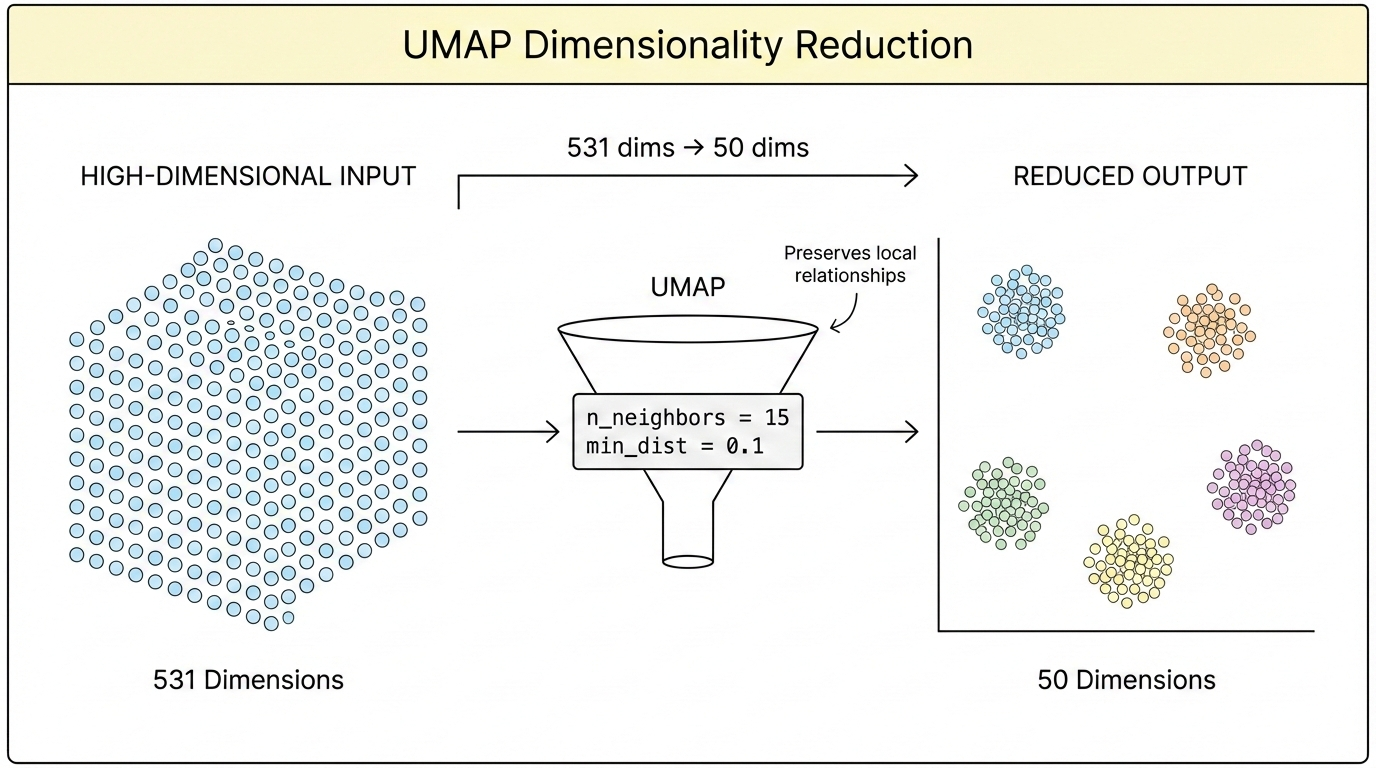
Imagine plotting every ad in a 531-dimensional space (all features combined). Similar ads would be close together; different ads would be far apart.
Clustering algorithms find natural groupings in this space, without being told how many groups to look for.
The system uses two algorithms in sequence:
- UMAP: Compresses 531 dimensions down to 50 (while preserving relationships)
- HDBSCAN: Finds clusters in the compressed space
What the Clusters Reveal
The system automatically labels each cluster based on its characteristics:
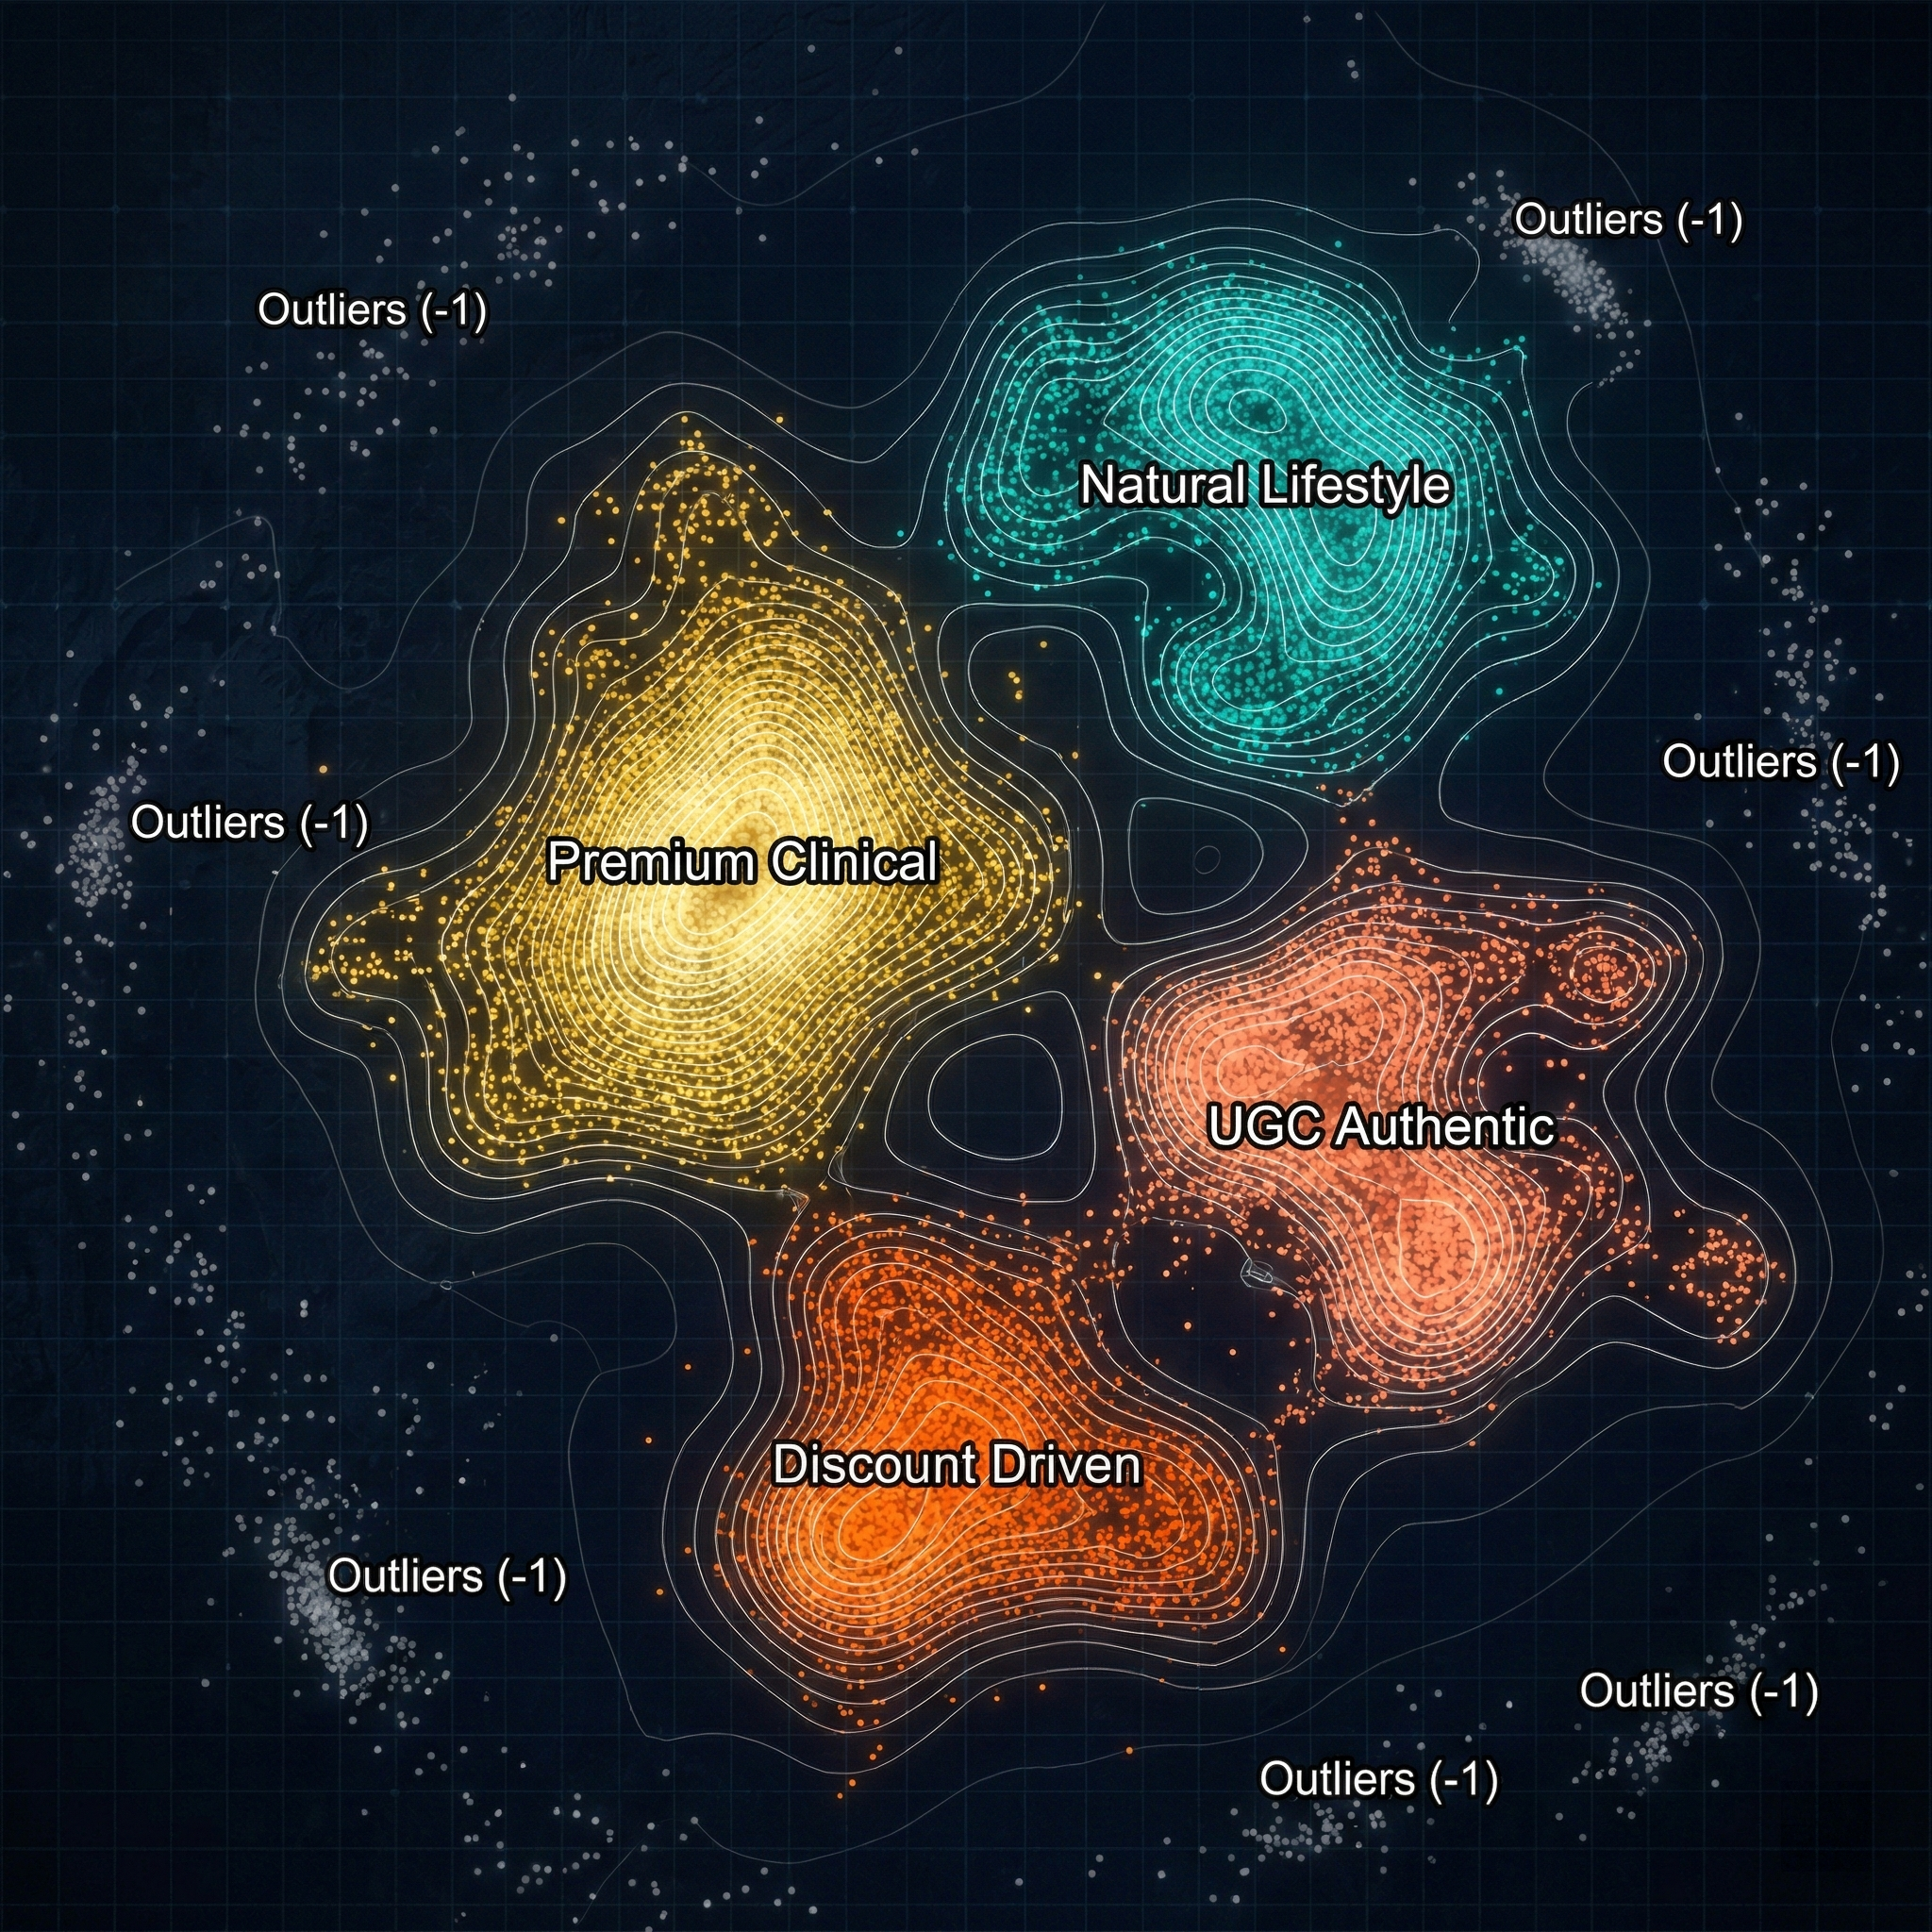
Five distinct competitor strategies emerge automatically from the data.
This reveals: - Which strategies exist in a market - Which brands are competing in each space - Where the gaps are (strategies no one is using)
Brand Focus Score
The system also calculates a “focus score” for each brand:
- 1.0 = All ads in one cluster (very focused strategy)
- 0.0 = Ads spread across all clusters (scattered strategy)
Focused brands tend to build stronger positioning. Scattered brands often signal unclear marketing direction.
Key Insights from Analysis
After analyzing thousands of ads, clear patterns emerge:
Insight 1: Video Dominates
The single strongest predictor of ad success? Having video instead of static images.
Video ads show 40%+ higher longevity correlation. If a brand is still running mostly static images, performance is likely being left on the table.
Insight 2: Quality Has a Threshold
The Vision AI assigns a quality score (1-10) to each image. Ads scoring below 6 rarely succeed, regardless of other factors.
There’s a minimum quality bar. Below it, nothing else matters.
Insight 3: Rare Combinations Win
The highest-performing cluster? “Premium Clinical,” ads that combine scientific/clinical claims with high production quality.
Surprisingly few brands occupy this space, despite its performance. Most brands default to either premium OR clinical, rarely both.
Insight 4: Multi-Platform Distribution Helps
Ads running on both Facebook and Instagram perform better than single-platform campaigns. The data doesn’t explain why (possibly broader reach, possibly algorithmic preference), but the correlation is clear.
Want to build something amazing?
Let's discuss how we can help automate your workflows and scale your business.
Book a Call